
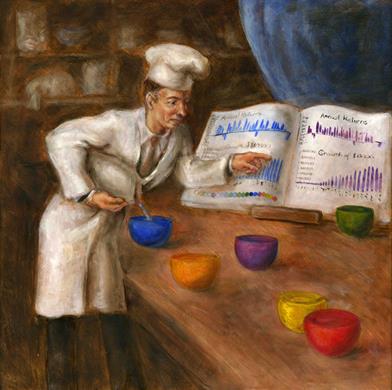
 Risk Exposure
In the early 1950s, a young Harry Markowitz applied his mathematical expertise to investing. Markowitz, then a Ph.D. candidate in economics at the University of Chicago, believed investment professionals erred by urging investors to focus solely on returns of individual stocks with no consideration of the concept of risk exposure. He set out to reveal how investors could improve their stock market investing performance by optimizing the trade-off between risk and return. In his 1952 Nobel Prize-winning paper, “Portfolio Selection,”1 Markowitz established the importance of diversification. He asserted the best portfolios include non-correlated stocks that act and move independently from each other. Today, I estimate that trillions of dollars worldwide are invested according to his principles of risk and return, known collectively as Modern Portfolio Theory.
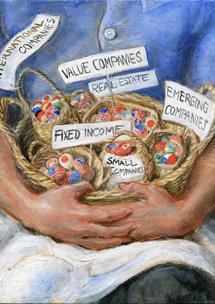
The blend of investments that is appropriate for a particular investor is known as asset allocation, also called risk exposure, and is based on an investor’s risk capacity. Asset allocation is the most important factor in optimizing a portfolio’s expected return, thus it is essentially the most important decision an individual investor can make. This concept also extends to larger institutional investments-such as state pension funds, fire and police pension plans, non-profit and for-profit defined contribution plans, church funds, college endowments, and any other funds governed by committees.
As presented in Step 8, Nobel Prize-winner Eugene Fama and professor Kenneth French identified that as much as 96% of equity returns are explained by a portfolio’s exposure to market, size and value. Their research expanded upon Markowitz’s and Sharpe’s initial findings regarding risk and return. While Fama and French demonstrated that indexes constructed of small and value companies have historically outperformed the total market index over the long term, the risks associated with these small and value indexes have also been higher.
Some investors tend to avoid risk when it comes to their investments. They want high returns with low risks. But avoiding risks positions investors to avoid returns. Some take on too much risk, while others take risks that just haven’t been properly rewarded. All of these behaviors are at the crux of the poor performance many investors experience. Risk should be embraced in appropriate doses that match an investor’s risk capacity. There is a right amount and type of risk for every investor. Risk provides opportunity, and a taste for appropriate risk is a good thing.
As was shown in Step 9, certain asset classes, such as small and value, have had a long history of sufficiently rewarding investors for the risks associated with them. However, there are also several asset classes that carry risk but have been inefficient in delivering returns commensurate with the risks taken. This kind of risk is not worth taking. As such, many investors struggle to develop an asset allocation that captures the right blend of the markets that have maximized returns at given levels of risk. A case in point: many investors seem comfortable investing in companies that are best described as glamour or large growth stocks, presuming they perform better than small or value stocks. These investors would be surprised to learn that growth companies actually have a poor history of delivering risk-commensurate returns. Commodities, private-equity, long-term bonds and technology stocks have also failed to historically maximize returns for risks taken. Failing to understand which blend of investments are worth their risk could cause investors to earn lower returns than they could if they simply bought, held and rebalanced a blend of indexes that optimizes returns at a given level of risk.
Commodities have developed a reputation for providing a hedge against inflation and a low correlation to equities. Further research into this subject reveals that no such advantage exists. A study2 by former USC finance professor, Truman Clarke, details the lack of substantiation for the claims made by commodities proponents. A commodity is purchased with the hope that an increased demand or a decreased supply of the item will cause its price to increase. “Remember when you buy a commodity, you’re not buying something that generates earnings and profit. You’re buying a hard asset and hoping another buyer will be willing to pay more for that asset in the future,” wrote Matt Krantz in a June 2008 USA Today article titled, “Read This Before You Jump on the Commodities Bandwagon.”3
Commodity investments differ from stock investments in that the companies in the S&P 500 Index have earned profits that have produced an average return of about 9.87% per year for the last 90 years, ending December 2017. Their stock price is expected to increase in-line with their growth in profits. The expectation of price appreciation for commodities is not based on profits, but rather on supply and demand. In short, commodities have not provided expected returns much greater than inflation.
Noted economist and professor of finance at Dartmouth, Kenneth French, conveyed his findings regarding commodities. He concluded, “The high volatility of commodity prices makes it impossible to accurately estimate the expected returns, volatilities and covariances of commodity funds, but theory suggests that if commodity returns are negatively correlated with the rest of the market, the expected risk premium on commodities is small, perhaps negative. Finally, commodity funds are poor inflation hedges. Most of the variation in commodity prices is unrelated to inflation. In fact, commodity indices are typically 10 to 15 times more volatile than inflation. As a result, investors who use commodity funds to hedge inflation almost certainly increase the risk of their portfolios.”4
 Diversification
A diversified portfolio which captures the right blend of market indexes reaps the benefit of carrying the systematic risk of the entire market while minimizing exposure to the unsystematic and concentrated risk associated with individual stocks and bonds, countries, industries or sectors. The only risk that remains is the risk of the market itself, a risk that must be taken in order to capture market returns.
As capitalism has expanded throughout the world, it has become increasingly important to allocate a significant portion of one’s portfolio to international and emerging markets securities. In the 1970’s, the U.S. comprised more than 68% of global equity value, but today it comprises about 50%.5 Investors achieve the benefit of increasing diversification and capturing the expected returns of global capitalism by investing in index funds comprised of international developed countries and emerging markets countries in risk-appropriate doses.
An additional important aspect of diversification is diversifying across time. When investors maintain a globally diversified portfolio for long periods of time, they are able to maximize their ability to capture the complete range of returns that are offered by the global markets. Index portfolios with a high exposure to stocks require a longer holding period than fixed income portfolios in order to maximize the probability of achieving an expected outcome.

Investors should think of their portfolios as an investment in global capitalism. This hypothetical stock certificate represents an investment in Capitalism, Inc., showing estimates for year-end 2017 of total market value, sales, profits, number of CEOs, and number of employees who work for an investor who buys a globally diversified index portfolio. With a total market capitalization of $51 trillion, more than 13,000 CEOs worldwide and nearly 83 million employees selling products in 195 countries, it is not reasonable to believe that Capitalism, Inc. will go out of business. And if it did... your money would be worthless.
The stacked chart of Figure 11-1 shows the general asset class allocations for 20 of 100 different risk-calibrated Index Portfolios. The Index Portfolio number matches the equities (stocks) allocation of that portfolio; i.e. Index Portfolio 20 has a 20% equities allocation, and Index Portfolio 80 has an 80% equities allocation. In the chart, gold represents each portfolio’s weighting in fixed income, and burgundy represents its percentage of equities. Almost all of the asset allocations carry the same asset class components — fixed income, U.S. stocks and non-U.S. stocks and REITs — but weighs each differently. For example, the least risky Index Portfolio displayed, number 5, is heavily weighted in fixed income, carrying very little global equity exposure. This portfolio is well suited to an investor with a very low risk capacity — in general, someone with a short investment time horizon and current liquidity needs. An example of this type of investor would be an older retiree. To really simplify the matching of people and portfolios, investors could match their age to the allocation of bonds in an index portfolio.
Figure 11-1(permalink)
The highest risk capacity Index Portfolio 100 may be suitable for either a very young investor just starting out or someone who fluently speaks Riskese, and will not need to liquidate his investments for a minimum of 15 years, has a high net worth and net income and a strong stomach for volatility.
The higher risk Index Portfolios 75 and 100 have a high stock market exposure and a considerable tilt toward small and value indexes. The increased volatility of these higher risk index portfolios had higher returns over the 35-year period from January 1, 1983 to December 31, 2017, relative to the less volatile Index Portfolios 25 and 50. As Figure 11-2 shows, an individual who invested $1 in a lower risk Index Portfolio 25 would have grown his investment to $10.00 in the 35-year period. However that same dollar invested in a higher risk Index Portfolio 100 would have grown to $61. This example provides evidence for the importance of establishing the efficient asset allocation that is best matched to an investor’s risk capacity.
Figure 11-2(permalink)
Once investors identify the asset allocation that matches their risk capacity, they have a choice to make as to how to best implement that asset allocation. A handful of passively managed fund providers offer asset class indexes, namely Vanguard and Dimensional Fund Advisors (Dimensional). In 2013, these two firms had the most cash inflows of all mutual fund families.6 The index portfolios referenced in this book are usually implemented with funds from Dimensional, a highly regarded fund company which provides indexes and funds based on the Fama/French Five-Factor Model, purposefully isolating risk factors to efficiently capture higher expected returns. They have recently added a sixth factor known as Direct Profitability (to be further detailed in future editions of this book).
Figure 11-3 illustrates a 19-year comparison between 20 index portfolios implemented with funds from Dimensional and Vanguard, and with the same stock/bond allocations. The time period shown reflects the longest time period for which we have live mutual fund data. All portfolio results are net of fund fees as well as a 0.9% advisor fee. The chart shows that the implementation of the index portfolios utilizing Dimensional funds had a higher annualized return than the portfolios utilizing Vanguard funds.
Figure 11-3(permalink)
Figure 11-4 is a similar chart that shows a 17-year comparison between the same 20 index portfolios implemented with Dimensional funds and iShares ETFs. The beginning date is two years later (due to the limited availability of live ETF data), but the results are similar. The size of the Dimensional advantage is directly proportional to the risk level of the portfolio. Although several brokerage firms offer a “free-trades” promotion with select ETFs, investors should proceed cautiously with their trades, staying cognizant of the bid/ask spread, and the possible divergence between market price and net asset value. Investors who do not understand what this means should refrain from trading ETFs altogether. Finally, lessons from Steps 4 and 6 show why investors must avoid the temptation to use ETFs as market-timing tools and tactical asset allocation.
Figure 11-4(permalink)
Dimensional funds are available through a select group of fiduciary registered investment advisors to whom the company provides comprehensive data from CRSP on numerous indexes dating all the way back to 1926. This allows for analysis of data that is usually only available to academic researchers.
Dimensional’s emphasis on educating advisors, who in turn, educate investors, is intended to improve the investor experience for the clients of fiduciary advisors.
Dalbar surveyed investment advisors four times between 1997 and 2004. In a study titled, “The Professionals’ Pick,” advisors rated Dimensional the best overall no-load mutual fund company in 1997, 2000, 2002, and number two in 2004. Dimensional was also ranked #2 for Advisor Commitment in 2010 and 2011 by Cogent Research and #1 by Barron’s in 2010. In 2014, Dimensional was the focus of a feature article, with Nobel Prize winner Eugene Fama and Dimensional CEO and founder David Booth gracing the cover of the publication. In 2017, Dimensional was named “Retirement Leader of the Year” by Fund Intelligence. See Figure 11-5 for a summary of their accolades.
Figure 11-5(permalink)
A globally diversified index portfolio has historically delivered reasonable returns for the risk that is built into each portfolio. Figure 11-6 plots the risk and reward for 20 index portfolios and various indexes, along with an S&P 500 Index over the 50-year period from January 1, 1968 to December 31, 2017. Note the higher annualized returns of the index portfolios that have had similar risk (annualized standard deviation) as the S&P 500 Index. Also note the returns of the emerging market indexes when isolated on their own (high risk with compensated returns). The index portfolios shown are all comprised of an efficient blend of indexes. Also, note the square buttons that I advise clients to avoid in efficient portfolios.
Figure 11-6(permalink)
The chart shows the S&P 500 had similar risk characteristics (14.99%) as Index Portfolio 95 (15.16%) but delivered a lower return: 10.12% vs. 11.96%. The S&P 500 Index actually delivered an annualized return comparable to the return of Index Portfolio 65 with 35% fixed income, which shows that similar returns were available at lower risk. A higher annualized return could have been delivered by taking less risk. This chart shows the value of diversifying beyond large cap companies in the U.S., as reflected in the S&P 500 Index. Portfolios 65-95 all delivered higher annualized returns with similar or less risk than the S&P 500 Index.
Figure 11-7 shows 50 years of monthly return distributions for four index portfolios. These histograms represent 600 months of monthly risk and return data for the 50 years from January 1, 1968 to December 31, 2017. Note the wider bell curve distributions in the higher risk Index Portfolios 100 and 75 as compared to the lower risk Index Portfolios 50 and 25. The riskier portfolios had a larger range of outcomes over time.
Figure 11-7(permalink)
This wider range or increased volatility has also carried a higher average return. Of the four portfolios shown, the most risky Index Portfolio 100 had the widest range of monthly return outcomes over the 50-year period. This wider range or increased volatility is the trade-off for higher returns, relative to Index Portfolios 25, 50 and 75 that had lower risk and lower returns. The charts also reflect the growth of a $1 investment in each portfolio over the 50-year period. Remember that an investor’s actual returns will vary from these returns due to the timing of withdrawals and contributions, rebalancing strategies, costs, fees and other factors.
As was shown in the previous charts and discussions, diversification among low-cost index funds is a very effective means for investing. While one cannot obtain any guarantee of future success based on the past, the 50 or 90 years of data associated with the style-pure index portfolios is arguably, and evidentially, as good as it gets for any investor, individual or institution.
The data table in Figure 11-8 represents the short-term and long-term risk and return data for the S&P 500 and 10 index portfolios with varying degrees of exposure to bonds and stocks. Growth of $1 is also shown for each portfolio. When seeking to construct a portfolio, it is advisable for investors to pay careful attention to the 20, 50 and 90-year data columns on the right hand side. The 50-year return is largely considered the historic return and a good estimate of the future or expected return over 15-year or greater periods. The left columns which show the year-to-date, one-, three- and five-year returns are shown in order to make investors aware of the short-term volatility of the various investments and should not be considered useful for determining which portfolio is right for an investor.
Figure 11-8
Unlike horseshoes, close enough isn’t good enough for investors who want to maximize their ability to capitalize on the tradeoff between risk and return. For this reason, when selecting a risk exposure, the primary consideration should be identifying and investing in a blend of indexes that most closely matches risk capacity.
An investor’s optimal strategy is to invest in a portfolio that directly corresponds to a particular risk capacity, capturing every available increment of risk exposure. This more refined approach enables investors to take on just the right amount of risk, allowing them to identify an appropriate portfolio.
The benefits associated with capturing just the right amount of risk are displayed in Figure 11-9, which shows the growth of $1,000 in 100 different index portfolios over the 50 years from 1968 through 2017. Each of these sophisticated index portfolios is designed with different blends of equities and fixed income. This continuum of risk and return provides investors the opportunity to invest in a targeted asset allocation that matches their risk capacity score between 1 and 100. The chart further validates the value of carefully matching an investor’s risk capacity to a corresponding risk exposure. As you can see, a small change in risk made a sizeable difference in the growth of $1,000 over this 50-year period.
Figure 11-9(permalink)
The process of prudent long-term investing requires thorough and thoughtful discernment. The best way to earn optimal returns is by buying and holding a passively managed and globally diversified index portfolio, matching an investor’s risk exposure to his or her risk capacity and relying on 90 years of historical risk and returns data. In Step 10, an explanation of four unique risk capacities was provided for risk capacity scores of 100, 75, 50 and 25. Fact sheets showing risk and return data for the four index portfolios that match those risk capacity scores are provided on the following pages.
IFA Index Portfolios 100
IFA Index Portfolios 75
IFA Index Portfolios 50
IFA Index Portfolios 25
These portfolio fact sheets consist of simulated passive investor experiences with returns and volatility data, charts that represent annual returns and growth of $1, a 50-year monthly rolling period analysis, and a histogram of monthly rolling periods for the time intervals matched to the average holding periods that are appropriate for each risk exposure. For an investment period of a given length; e.g. three years, this rolling period table will show how many periods there were in the entire 50-year period (in this case, 600), the median annualized return over all these periods, as well as both the highest and the lowest returns that occurred in these periods. The very clear pattern that emerges is that as the period length increases, the median return changes very little, but the range of returns narrows considerably. We refer to this as the benefit of time-diversification of returns.
See Appendix A (https://www.ifa.com/disclosures/)